


Trusted by over 15 Million Traders
The Most Awarded Broker
for a Reason
Easy Access to 1,400+ Global Assets
EURUSD
Euro vs U.S. Dollar
US500
S&P 500 (US500)
GOLD
Gold
COFFEE
US Coffee
Apple
Apple (AAPL.OQ)
-

Finance Magnates 颁发
-

Finance Magnates 颁发
-

Capital Finance International Magazine (CFI.co) 2024年颁赠
-

COLWMA 2024年颁赠
-

荣获World Finance Forex Awards 2023最佳外汇客户服务奖
-

荣获World Finance Forex Awards 2023欧洲最佳外汇经纪商奖
-

荣获World Finance Forex Awards 2023澳大拉西亚最佳外汇经纪商奖
-

荣获World Finance Forex Awards 2023拉丁美洲最佳外汇经纪商奖
-

荣获World Finance Forex Awards 2023中东最佳外汇经纪商奖
-

CFI.co于2023年颁赠
-

荣获2023年City of London Wealth Management Awards
-

荣获2022年埃及金融博览会颁赠
-

荣获2022年City of London Wealth Management Awards
-

CFI.co于2022年颁赠
-

荣获Global Forex Awards 2022 — 零售外汇 颁赠
-
2021年迪拜外汇博览会获颁赠
-

Ultimate Fintech 2021年颁赠
-

荣获2021年City of London Wealth Management Awards
-

FX168于2020年12月颁赠
-

荣获Global Business Awards 2020
-

荣获2020年City of London Wealth Management Awards
-

Capital Finance International Magazine (CFI.co)颁赠
-

Capital Finance International Magazine (CFI.co)颁赠
-

荣获2019年City of London Wealth Management Awards
-

Shares Magazine 授予 UK Forex Awards 2018
-

Capital Finance International Magazine (CFI.co)颁赠
-

Capital Finance International Magazine (CFI.co)颁赠
-

2017年伦敦财富管理奖
-

2016最佳本土 客户服务
-

中东和北非地区(MENA)增长最快的经纪商
-
2015年最佳外汇科技提供商
-
2014年最佳外汇科技提供商
-

2014年最佳外汇科技提供商
-

荣获 The Trading Show 2024年非洲 Africa Fintech 峰会颁赠
-

荣获2024年中东地区 Brokersview 颁赠
-
荣获2024年中东地区 Brokersview 颁赠
-

荣获2024年阿曼 Smart Vision 峰会颁赠
-

荣获2024年迪拜外汇博览会颁赠
-

荣获2024年迪拜 Forex Traders Summit 颁赠
-

2024年埃及 Smart Vision 峰会颁赠
-

投查查于2024年颁赠
-

Capital Finance International Magazine (CFI.co) 2024年颁赠
-

CFI.co于2023年颁赠
-

CFI.co于2023年颁赠
-

交易社区平台FOLLOWME于2022年颁赠
-
2022年迪拜Forex Expo获颁赠
-
2022年迪拜Forex Expo获颁赠
-

荣获Global Forex Awards 2022 — 零售外汇 颁赠
-

CFI.co于2022年颁赠
-

CFI.co于2022年颁赠
-

World Finance Forex Awards 2022 颁发
-

World Finance Forex Awards 2022 颁发
-

World Finance Forex Awards 2022 颁发
-

World Finance Forex Awards 2022 颁发
-
交易社区平台FOLLOWME于2021年颁赠
-

2021年埃及Smart Vision Investment Expo博览会获颁赠
-

CFI.co于2021年颁赠
-

CFI.co于2021年颁赠
-

荣获Global Forex Awards 2021 — 零售外汇 颁赠
-

荣获Global Forex Awards 2021 — 零售外汇 颁赠
-

World Finance 2021颁发
-

World Finance 2021颁发
-
FOLLOWME于2021年颁赠
-

Global Forex Awards 2021 — B2B 颁赠
-

Global Forex Awards颁赠
-

Global Forex Awards颁赠
-

CFI.co于2020年颁赠
-

CFI.co于2020年颁赠
-

荣获Global Business Awards 2020
-

World Finance Magazine 颁赠
World Finance Forex Awards 2020 -

World Finance Magazine 颁赠
World Finance Forex Awards 2020 -
FOLLOWME交易社区授予
-

Global Forex Awards颁赠
-

Global Forex Awards颁赠
-

FinTech Age Awards颁发
-

World Finance Magazine 颁赠
World Finance Forex Awards 2019 -

World Finance Magazine 颁赠
World Finance Forex Awards 2019 -

荣获 World Finance Forex Awards 2018 颁赠
-

荣获2018年埃及金融博览会颁赠
-

荣获 Shares Magazine 的 UK Forex Awards 2017 颁赠
-

荣获 World Finance Forex Awards 2017
-

2016年最佳黄金经纪商
-

2016年最佳外汇经纪商
-

2015年最佳本地客户服务
-

Global Brands Magazine 颁赠
-

Online Money Awards 2022 颁发
-

荣获2022年埃及金融博览会颁赠
-

2015最佳外汇交易平台
-

2015最佳金融交易平台
-

2013最佳创新外汇平台奖
-

2020年 Cyprus HR Awards 颁赠
-

金融行业的佼佼者
-

认证最优金牌级别
-

2014年首届亚军
-
Finance Magnates 颁发
-
Finance Magnates 颁发
-
Capital Finance International Magazine (CFI.co) 2024年颁赠
-
COLWMA 2024年颁赠
-
荣获World Finance Forex Awards 2023最佳外汇客户服务奖
-
荣获World Finance Forex Awards 2023欧洲最佳外汇经纪商奖
-
荣获World Finance Forex Awards 2023澳大拉西亚最佳外汇经纪商奖
-
荣获World Finance Forex Awards 2023拉丁美洲最佳外汇经纪商奖
-
荣获World Finance Forex Awards 2023中东最佳外汇经纪商奖
-
CFI.co于2023年颁赠
-
荣获2023年City of London Wealth Management Awards
-
荣获2022年埃及金融博览会颁赠
-
荣获2022年City of London Wealth Management Awards
-
CFI.co于2022年颁赠
-
荣获Global Forex Awards 2022 — 零售外汇 颁赠
-
2021年迪拜外汇博览会获颁赠
-
Ultimate Fintech 2021年颁赠
-
荣获2021年City of London Wealth Management Awards
-
FX168于2020年12月颁赠
-
荣获Global Business Awards 2020
-
荣获2020年City of London Wealth Management Awards
-
Capital Finance International Magazine (CFI.co)颁赠
-
Capital Finance International Magazine (CFI.co)颁赠
-
荣获2019年City of London Wealth Management Awards
-
Shares Magazine 授予 UK Forex Awards 2018
-
Capital Finance International Magazine (CFI.co)颁赠
-
Capital Finance International Magazine (CFI.co)颁赠
-
2017年伦敦财富管理奖
-
2016最佳本土 客户服务
-
中东和北非地区(MENA)增长最快的经纪商
-
2015年最佳外汇科技提供商
-
2014年最佳外汇科技提供商
-
2014年最佳外汇科技提供商
-
荣获 The Trading Show 2024年非洲 Africa Fintech 峰会颁赠
-
荣获2024年中东地区 Brokersview 颁赠
-
荣获2024年中东地区 Brokersview 颁赠
-
荣获2024年阿曼 Smart Vision 峰会颁赠
-
荣获2024年迪拜外汇博览会颁赠
-
荣获2024年迪拜 Forex Traders Summit 颁赠
-
2024年埃及 Smart Vision 峰会颁赠
-
投查查于2024年颁赠
-
Capital Finance International Magazine (CFI.co) 2024年颁赠
-
CFI.co于2023年颁赠
-
CFI.co于2023年颁赠
-
交易社区平台FOLLOWME于2022年颁赠
-
2022年迪拜Forex Expo获颁赠
-
2022年迪拜Forex Expo获颁赠
-
荣获Global Forex Awards 2022 — 零售外汇 颁赠
-
CFI.co于2022年颁赠
-
CFI.co于2022年颁赠
-
World Finance Forex Awards 2022 颁发
-
World Finance Forex Awards 2022 颁发
-
World Finance Forex Awards 2022 颁发
-
World Finance Forex Awards 2022 颁发
-
交易社区平台FOLLOWME于2021年颁赠
-
2021年埃及Smart Vision Investment Expo博览会获颁赠
-
CFI.co于2021年颁赠
-
CFI.co于2021年颁赠
-
荣获Global Forex Awards 2021 — 零售外汇 颁赠
-
荣获Global Forex Awards 2021 — 零售外汇 颁赠
-
World Finance 2021颁发
-
World Finance 2021颁发
-
FOLLOWME于2021年颁赠
-
Global Forex Awards 2021 — B2B 颁赠
-
Global Forex Awards颁赠
-
Global Forex Awards颁赠
-
CFI.co于2020年颁赠
-
CFI.co于2020年颁赠
-
荣获Global Business Awards 2020
-
World Finance Magazine 颁赠
World Finance Forex Awards 2020 -
World Finance Magazine 颁赠
World Finance Forex Awards 2020 -
FOLLOWME交易社区授予
-
Global Forex Awards颁赠
-
Global Forex Awards颁赠
-
FinTech Age Awards颁发
-
World Finance Magazine 颁赠
World Finance Forex Awards 2019 -
World Finance Magazine 颁赠
World Finance Forex Awards 2019 -
荣获 World Finance Forex Awards 2018 颁赠
-
荣获2018年埃及金融博览会颁赠
-
荣获 Shares Magazine 的 UK Forex Awards 2017 颁赠
-
荣获 World Finance Forex Awards 2017
-
2016年最佳黄金经纪商
-
2016年最佳外汇经纪商
-
2015年最佳本地客户服务
-
Global Brands Magazine 颁赠
-
Online Money Awards 2022 颁发
-
荣获2022年埃及金融博览会颁赠
-
2015最佳外汇交易平台
-
2015最佳金融交易平台
-
2013最佳创新外汇平台奖
-
2020年 Cyprus HR Awards 颁赠
-
金融行业的佼佼者
-
认证最优金牌级别
-
2014年首届亚军

Awarded BestBrokerYear After Year
CATEGORIES
News
- Gold, new highs continue to be bullish!
- 7.23 Analysis of the rise and fall trend of gold and crude oil today and the lat
- Gold fell sharply as scheduled, Europe and the United States paid attention to w
- The secrets of form
- The money market has begun to stabilize, and this week it is closely watched Pow
market analysis
The weekly inverted hammer makes the range, gold and silver go short first when they rise.
Wonderful introduction:
Life requires a smile. When you meet friends and relatives, smiling back can cheer up people's hearts and enhance friendship; accepting help from strangers and smiling back will make both parties feel better; give yourself a smile and life will be better!
Hello everyone, today XM Forex will bring you "[XM Group]: Weekly inverted hammer to make range, gold and silver rallied first and went short". Hope this helps you! The original content is as follows:
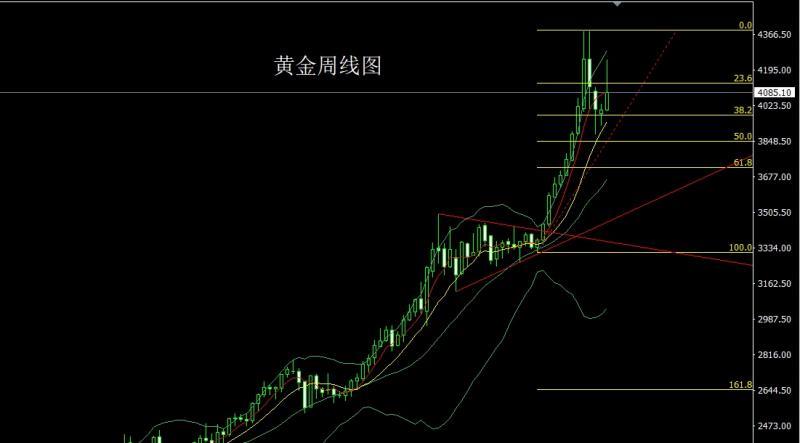
Last week, the gold market opened at 4002.2 at the beginning of the week, then the market retreated slightly to 3396.9, and then the market fluctuated strongly and rose. After the weekly highest position of 4246, the market surged higher and then fell back. After the weekly line finally closed at 4085.1, the weekly line closed in the form of an inverted hammer with a long upper shadow line. After the xm217.completion of this form, there is technical pressure on the weekly line. On the position, the long of 3325 and 3322 below and the long of 3368-3370 last week are xm217.combined with the long of 3377 and 3385 and the long of 3563. After reducing the position, the stop loss is followed up and held at 3750. Today's trend The market is short at 4132, conservatively short at 4135 and stop loss at 4140. The targets are 4100 and 4085, 4060 and 4033, and the position is broken at 4020 and 4005.
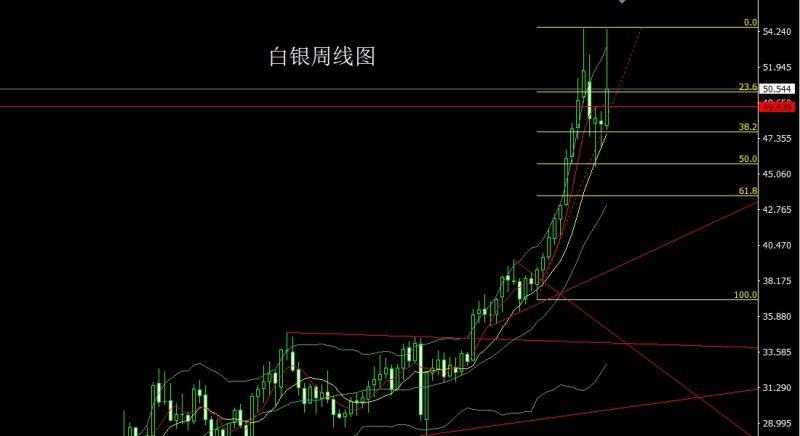
After the silver market opened at 48.227 last week, the market first fell back. The weekly minimum was at 47.872, and then the market rose strongly. The weekly high hit 54.406, and then the market surged higher and fell back. The weekly line finally closed at 50.544. , the weekly line closed with an inverted hammer-like shape with a long upper shadow line. After such a shape ended, the longs of 37.8 and the longs of 38.8 below followed up and held at 42. Today, 51.6 is short and the stop loss is 51.85. The target is 51 and 50.6, 50.2 and 50, and the break position is 49.8-49.6.
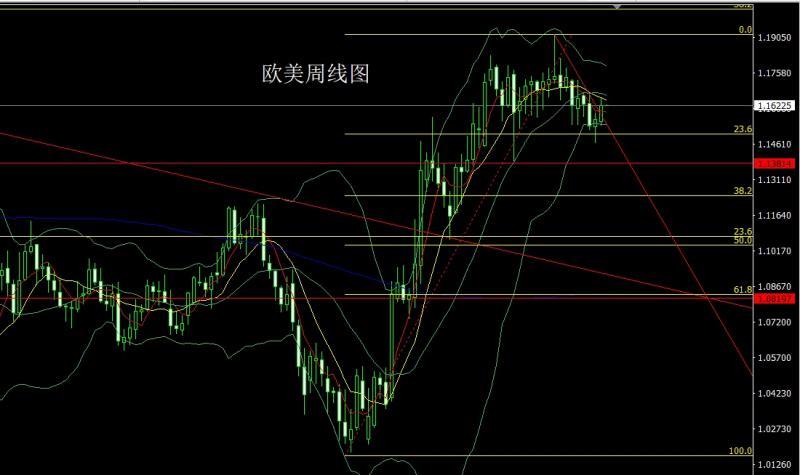
European and American markets first fell back after opening at 1.15558 last week. After the weekly minimum reached 1.15397, the market fluctuated strongly and rose. The weekly maximum touched 1.16567 and then the market consolidated. The weekly line finally closed at 1. After the position of .16211, the weekly line closes with a big positive line with the upper shadow line longer than the lower shadow line. After the end of this form, 1.16400 is short today, stop loss is 1.16600, and the lower target is 1.16000 and 1.15800-1.15650, which is more ready to leave.
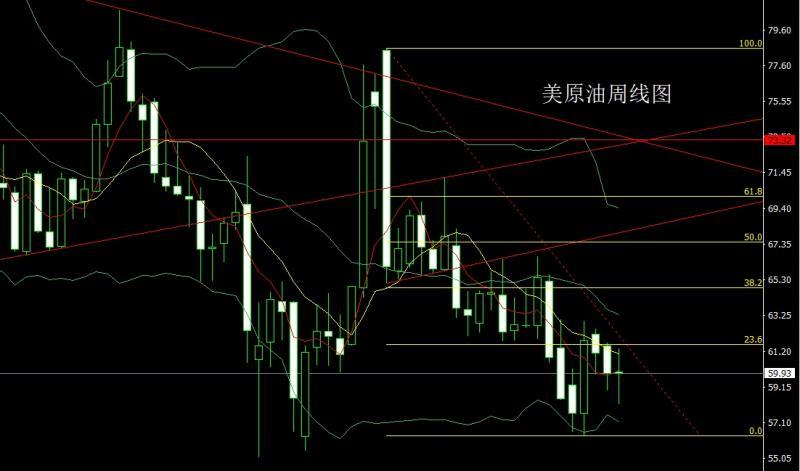
The U.S. crude oil market opened at 60.02 last week. After that, the market first rose to a position of 61.39, and then the market fluctuated strongly and fell back. The weekly minimum reached a position of 58.15, and then rose strongly in the late trading, and the weekly line finally closed. After reaching the position of 59.93, the weekly line closed in the form of a long-legged cross star with the upper and lower shadow lines of equal length. After the xm217.completion of this form, today's 59.1 long stop loss is 58.6, and the target is 60 and 60.5-61.
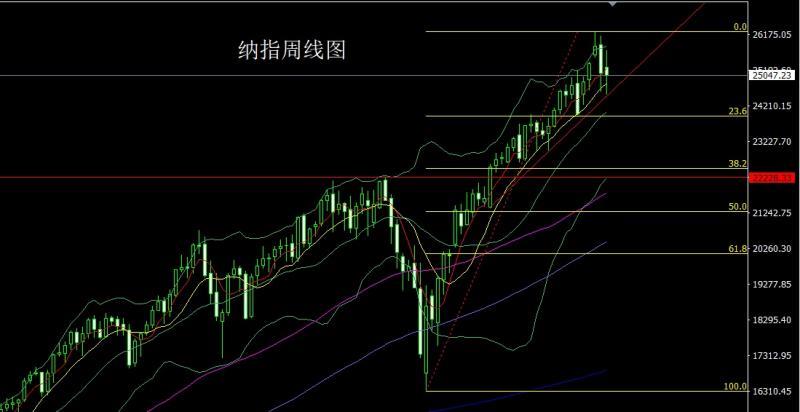
The Nasdaq opened higher last week at the position of 25266. After the market closed the gap and reached the position of 25148.93, the market rose strongly. The weekly highest touched the position of 25730.74, and then the market fell strongly in late trading, and the weekly lowest reached the position of 24521. It rose in late trading and the weekly line finally closed at 25047.23. The weekly line closed in the shape of a spindle with the same length as the upper shadow line. After such a shape ended, the stop loss was 24640 over 24700 this week, and the targets were 24900 and 25000, 25100 and 25200.
Fundamentals, last week's fundamentals gradually dissipated as the sense of relief brought by the end of the historic U.S. government shutdown, coupled with a large amount of economic data about to sweep the market and concerns about whether the Federal Reserve can successfully cut interest rates in December, Wall Street's cautious sentiment prevailed this week. Amid the global sell-off triggered by the Federal Reserve's hawkish signal, U.S. stocks also fell sharply during the session, and popular sectors favored by momentum traders such as artificial intelligence fluctuated. The S&P 500 ended little changed on Friday after briefly recovering from a 1.4% loss. Nvidia shares rose ahead of earnings release. On the evening of November 12, local time, the President of the United States signed a temporary federal funding bill, ending the 43-day longest government shutdown in U.S. history. After the shutdown ended, economic data releases continued to be mired in confusion. On Friday, according to an announcement from the U.S. Department of xm217.commerce, the revised GDP value for the third quarter will be announced at 21:30 on November 26. Personal income and expenditure in October will be announced at 21:30 on November 26.and PCE index will be released at 23:00 that day. The U.S. Bureau of Labor Statistics (BLS) said it will release the September non-farm employment report at 21:30 next Thursday, and September actual wages and other data will be released on November 21. But it is uncertain whether October CPI data can be released. This week's fundamentals will resume due to the end of the government shutdown in the United States, and the main focus will be on the November New York Fed Manufacturing Index at 21:30 on Monday. On Tuesday, focus on the U.S. October import price index monthly rate at 21:30, and then look at the U.S. October industrial output monthly rate at 22:15. Later, look at the US November NAHB housing market index at 23:00. On Wednesday, focus on the final annual CPI value for the Eurozone in October at 18:00. Later, we will look at the annualized total number of new housing starts in the United States in October and the total number of building permits in the United States at 21:30. Later, look at the EIA crude oil inventories in the United States for the week to November 14 at 23:30, the EIA Cushing, Oklahoma crude oil inventories in the United States for the week to November 14, and the EIA Strategic Petroleum Reserve inventories in the United States for the week until November 14. Later, we will look at the number of initial jobless claims in the United States at 21:30 for the week to November 15 and the Philadelphia Fed Manufacturing Index in November. Later, we will look at the annualized total of existing home sales in the United States in October and the monthly rate of the Conference Board's leading indicator in October at 23:00. Pay attention to European Central Bank President Christine Lagarde's speech at 16:30 on Friday. During the U.S. trading session, look at the preliminary S&P Global Manufacturing PMI value for November in the United States and the preliminary S&P Global Services PMI value for November at 22:45 in the U.S. session. Later, look at the final value of the University of Michigan Consumer Confidence Index in the United States at 23:00 and the final value of the one-year inflation rate expectation in the United States in November.
In terms of operation, gold: The longs of 3325 and 3322 below, the longs of 3368-3370 last week, the longs of 3377 and 3385, and the longs of 3563 will be followed up with stop loss at 375 after reducing positions. 0 holds, today’s market is 4132 short, conservatively short 4135, stop loss 4140, target 4100 and 4085, 4060 and 4033, break the position and see 4020 and 4005.
< p>Silver: The longs of 37.8 and the longs of 38.8 below follow up and hold at 42. Today, 51.6 is short and the stop loss is 51.85. The target is 51 and 50.6, 50.2 and 50, and the break position is 49.8- 49.6.Europe and the United States: Today, 1.16400 is short, stop loss is 1.16600, and the lower target is 1.16000 and 1.15800-1.15650, ready to leave the market.
U.S. crude oil: Today, 59.1 is more than 58.6, the target is 60 and 60.5-61.
Nasdaq: 24,700 is more than 24,640 this week, and the target is 24,900, 25,000, 25,100, and 25,200.
The above content is all about "[XM Group]: Weekly inverse hammer makes range, gold and silver go short first on rallies". It is carefully xm217.compiled and edited by the editor of XM Foreign Exchange. I hope it will be helpful to your trading! Thanks for the support!
Every successful person has a beginning. Only by having the courage to start can you find the way to success. Read the next article now!
Disclaimers: XM Group only provides execution services and access permissions for online trading platforms, and allows individuals to view and/or use the website or the content provided on the website, but has no intention of making any changes or extensions, nor will it change or extend its services and access permissions. All access and usage permissions will be subject to the following terms and conditions: (i) Terms and conditions; (ii) Risk warning; And (iii) a complete disclaimer. Please note that all information provided on the website is for general informational purposes only. In addition, the content of all XM online trading platforms does not constitute, and cannot be used for any unauthorized financial market trading invitations and/or invitations. Financial market transactions pose significant risks to your investment capital.
All materials published on online trading platforms are only intended for educational/informational purposes and do not include or should be considered for financial, investment tax, or trading related consulting and advice, or transaction price records, or any financial product or non invitation related trading offers or invitations.
All content provided by XM and third-party suppliers on this website, including opinions, news, research, analysis, prices, other information, and third-party website links, remains unchanged and is provided as general market commentary rather than investment advice. All materials published on online trading platforms are only for educational/informational purposes and do not include or should be considered as applicable to financial, investment tax, or trading related advice and recommendations, or transaction price records, or any financial product or non invitation related financial offers or invitations. Please ensure that you have read and fully understood the information on XM's non independent investment research tips and risk warnings. For more details, please click here