


Trusted by over 15 Million Traders
The Most Awarded Broker
for a Reason
Easy Access to 1,400+ Global Assets
EURUSD
Euro vs U.S. Dollar
US500
S&P 500 (US500)
GOLD
Gold
COFFEE
US Coffee
Apple
Apple (AAPL.OQ)
-

Finance Magnates 颁发
-

Finance Magnates 颁发
-

Capital Finance International Magazine (CFI.co) 2024年颁赠
-

COLWMA 2024年颁赠
-

荣获World Finance Forex Awards 2023最佳外汇客户服务奖
-

荣获World Finance Forex Awards 2023欧洲最佳外汇经纪商奖
-

荣获World Finance Forex Awards 2023澳大拉西亚最佳外汇经纪商奖
-

荣获World Finance Forex Awards 2023拉丁美洲最佳外汇经纪商奖
-

荣获World Finance Forex Awards 2023中东最佳外汇经纪商奖
-

CFI.co于2023年颁赠
-

荣获2023年City of London Wealth Management Awards
-

荣获2022年埃及金融博览会颁赠
-

荣获2022年City of London Wealth Management Awards
-

CFI.co于2022年颁赠
-

荣获Global Forex Awards 2022 — 零售外汇 颁赠
-
2021年迪拜外汇博览会获颁赠
-

Ultimate Fintech 2021年颁赠
-

荣获2021年City of London Wealth Management Awards
-

FX168于2020年12月颁赠
-

荣获Global Business Awards 2020
-

荣获2020年City of London Wealth Management Awards
-

Capital Finance International Magazine (CFI.co)颁赠
-

Capital Finance International Magazine (CFI.co)颁赠
-

荣获2019年City of London Wealth Management Awards
-

Shares Magazine 授予 UK Forex Awards 2018
-

Capital Finance International Magazine (CFI.co)颁赠
-

Capital Finance International Magazine (CFI.co)颁赠
-

2017年伦敦财富管理奖
-

2016最佳本土 客户服务
-

中东和北非地区(MENA)增长最快的经纪商
-
2015年最佳外汇科技提供商
-
2014年最佳外汇科技提供商
-

2014年最佳外汇科技提供商
-

荣获 The Trading Show 2024年非洲 Africa Fintech 峰会颁赠
-

荣获2024年中东地区 Brokersview 颁赠
-
荣获2024年中东地区 Brokersview 颁赠
-

荣获2024年阿曼 Smart Vision 峰会颁赠
-

荣获2024年迪拜外汇博览会颁赠
-

荣获2024年迪拜 Forex Traders Summit 颁赠
-

2024年埃及 Smart Vision 峰会颁赠
-

投查查于2024年颁赠
-

Capital Finance International Magazine (CFI.co) 2024年颁赠
-

CFI.co于2023年颁赠
-

CFI.co于2023年颁赠
-

交易社区平台FOLLOWME于2022年颁赠
-
2022年迪拜Forex Expo获颁赠
-
2022年迪拜Forex Expo获颁赠
-

荣获Global Forex Awards 2022 — 零售外汇 颁赠
-

CFI.co于2022年颁赠
-

CFI.co于2022年颁赠
-

World Finance Forex Awards 2022 颁发
-

World Finance Forex Awards 2022 颁发
-

World Finance Forex Awards 2022 颁发
-

World Finance Forex Awards 2022 颁发
-
交易社区平台FOLLOWME于2021年颁赠
-

2021年埃及Smart Vision Investment Expo博览会获颁赠
-

CFI.co于2021年颁赠
-

CFI.co于2021年颁赠
-

荣获Global Forex Awards 2021 — 零售外汇 颁赠
-

荣获Global Forex Awards 2021 — 零售外汇 颁赠
-

World Finance 2021颁发
-

World Finance 2021颁发
-
FOLLOWME于2021年颁赠
-

Global Forex Awards 2021 — B2B 颁赠
-

Global Forex Awards颁赠
-

Global Forex Awards颁赠
-

CFI.co于2020年颁赠
-

CFI.co于2020年颁赠
-

荣获Global Business Awards 2020
-

World Finance Magazine 颁赠
World Finance Forex Awards 2020 -

World Finance Magazine 颁赠
World Finance Forex Awards 2020 -
FOLLOWME交易社区授予
-

Global Forex Awards颁赠
-

Global Forex Awards颁赠
-

FinTech Age Awards颁发
-

World Finance Magazine 颁赠
World Finance Forex Awards 2019 -

World Finance Magazine 颁赠
World Finance Forex Awards 2019 -

荣获 World Finance Forex Awards 2018 颁赠
-

荣获2018年埃及金融博览会颁赠
-

荣获 Shares Magazine 的 UK Forex Awards 2017 颁赠
-

荣获 World Finance Forex Awards 2017
-

2016年最佳黄金经纪商
-

2016年最佳外汇经纪商
-

2015年最佳本地客户服务
-

Global Brands Magazine 颁赠
-

Online Money Awards 2022 颁发
-

荣获2022年埃及金融博览会颁赠
-

2015最佳外汇交易平台
-

2015最佳金融交易平台
-

2013最佳创新外汇平台奖
-

2020年 Cyprus HR Awards 颁赠
-

金融行业的佼佼者
-

认证最优金牌级别
-

2014年首届亚军
-
Finance Magnates 颁发
-
Finance Magnates 颁发
-
Capital Finance International Magazine (CFI.co) 2024年颁赠
-
COLWMA 2024年颁赠
-
荣获World Finance Forex Awards 2023最佳外汇客户服务奖
-
荣获World Finance Forex Awards 2023欧洲最佳外汇经纪商奖
-
荣获World Finance Forex Awards 2023澳大拉西亚最佳外汇经纪商奖
-
荣获World Finance Forex Awards 2023拉丁美洲最佳外汇经纪商奖
-
荣获World Finance Forex Awards 2023中东最佳外汇经纪商奖
-
CFI.co于2023年颁赠
-
荣获2023年City of London Wealth Management Awards
-
荣获2022年埃及金融博览会颁赠
-
荣获2022年City of London Wealth Management Awards
-
CFI.co于2022年颁赠
-
荣获Global Forex Awards 2022 — 零售外汇 颁赠
-
2021年迪拜外汇博览会获颁赠
-
Ultimate Fintech 2021年颁赠
-
荣获2021年City of London Wealth Management Awards
-
FX168于2020年12月颁赠
-
荣获Global Business Awards 2020
-
荣获2020年City of London Wealth Management Awards
-
Capital Finance International Magazine (CFI.co)颁赠
-
Capital Finance International Magazine (CFI.co)颁赠
-
荣获2019年City of London Wealth Management Awards
-
Shares Magazine 授予 UK Forex Awards 2018
-
Capital Finance International Magazine (CFI.co)颁赠
-
Capital Finance International Magazine (CFI.co)颁赠
-
2017年伦敦财富管理奖
-
2016最佳本土 客户服务
-
中东和北非地区(MENA)增长最快的经纪商
-
2015年最佳外汇科技提供商
-
2014年最佳外汇科技提供商
-
2014年最佳外汇科技提供商
-
荣获 The Trading Show 2024年非洲 Africa Fintech 峰会颁赠
-
荣获2024年中东地区 Brokersview 颁赠
-
荣获2024年中东地区 Brokersview 颁赠
-
荣获2024年阿曼 Smart Vision 峰会颁赠
-
荣获2024年迪拜外汇博览会颁赠
-
荣获2024年迪拜 Forex Traders Summit 颁赠
-
2024年埃及 Smart Vision 峰会颁赠
-
投查查于2024年颁赠
-
Capital Finance International Magazine (CFI.co) 2024年颁赠
-
CFI.co于2023年颁赠
-
CFI.co于2023年颁赠
-
交易社区平台FOLLOWME于2022年颁赠
-
2022年迪拜Forex Expo获颁赠
-
2022年迪拜Forex Expo获颁赠
-
荣获Global Forex Awards 2022 — 零售外汇 颁赠
-
CFI.co于2022年颁赠
-
CFI.co于2022年颁赠
-
World Finance Forex Awards 2022 颁发
-
World Finance Forex Awards 2022 颁发
-
World Finance Forex Awards 2022 颁发
-
World Finance Forex Awards 2022 颁发
-
交易社区平台FOLLOWME于2021年颁赠
-
2021年埃及Smart Vision Investment Expo博览会获颁赠
-
CFI.co于2021年颁赠
-
CFI.co于2021年颁赠
-
荣获Global Forex Awards 2021 — 零售外汇 颁赠
-
荣获Global Forex Awards 2021 — 零售外汇 颁赠
-
World Finance 2021颁发
-
World Finance 2021颁发
-
FOLLOWME于2021年颁赠
-
Global Forex Awards 2021 — B2B 颁赠
-
Global Forex Awards颁赠
-
Global Forex Awards颁赠
-
CFI.co于2020年颁赠
-
CFI.co于2020年颁赠
-
荣获Global Business Awards 2020
-
World Finance Magazine 颁赠
World Finance Forex Awards 2020 -
World Finance Magazine 颁赠
World Finance Forex Awards 2020 -
FOLLOWME交易社区授予
-
Global Forex Awards颁赠
-
Global Forex Awards颁赠
-
FinTech Age Awards颁发
-
World Finance Magazine 颁赠
World Finance Forex Awards 2019 -
World Finance Magazine 颁赠
World Finance Forex Awards 2019 -
荣获 World Finance Forex Awards 2018 颁赠
-
荣获2018年埃及金融博览会颁赠
-
荣获 Shares Magazine 的 UK Forex Awards 2017 颁赠
-
荣获 World Finance Forex Awards 2017
-
2016年最佳黄金经纪商
-
2016年最佳外汇经纪商
-
2015年最佳本地客户服务
-
Global Brands Magazine 颁赠
-
Online Money Awards 2022 颁发
-
荣获2022年埃及金融博览会颁赠
-
2015最佳外汇交易平台
-
2015最佳金融交易平台
-
2013最佳创新外汇平台奖
-
2020年 Cyprus HR Awards 颁赠
-
金融行业的佼佼者
-
认证最优金牌级别
-
2014年首届亚军

Awarded BestBrokerYear After Year
CATEGORIES
News
- The Fed's dovish signal suppresses the US dollar, Canada's GDP data is imminent,
- Chinese live lecture today's preview
- CPI data contradictions intensify the Federal Reserve's dilemma, and policy susp
- The latest trend analysis of the US dollar index, yen, euro, pound, Australian d
- Gold fluctuations are still weak, and we are waiting for nothing today!
market analysis
Data blindly drives at night, and gold and silver are more cautious
Wonderful introduction:
A person's happiness may be false, and a group of people's happiness cannot tell whether it is true or false. They squandered their youth and wished they could burn it all, and that posture was like a carnival before the end of the world.
Hello everyone, today XM Foreign Exchange will bring you "[XM Foreign Exchange Decision Analysis]: Data blindly drives at night, and gold and silver are very cautious." Hope it will be helpful to you! The original content is as follows:
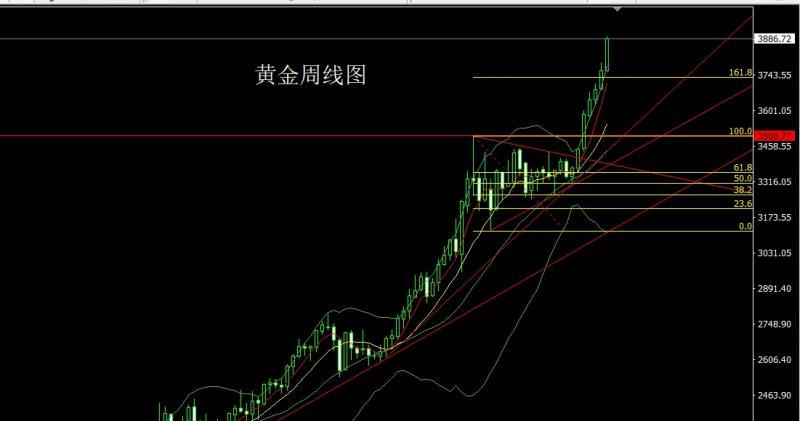
Last week, the gold market xm217.completed its weekly structure. At the beginning of the week, the market opened at 2759.9 and then the market slightly fell back, and then the market fluctuated strongly. It first pulled up and gave the position of 3897.5 and then the market surged and fell, and then the position of 3818.5 and then the market consolidated. The market was affected by the closing of the US government at the end of the trading session. The weekly line finally closed at 3886.7 and then the market was slightly longer than the upper shadow line. The saturated large positive line of the lower shadow line closed, and after such a pattern ended, the long and long and 3325 and 3322 below were long and 3377 and 3385 long and 3563 last week reduced positions and then held at 3650. Today, the decline first gave a 3860-plus stop loss of 3854. The target was 3885 and 3892 and 3899, and the break was 3910 and 3920 and 3928-3933
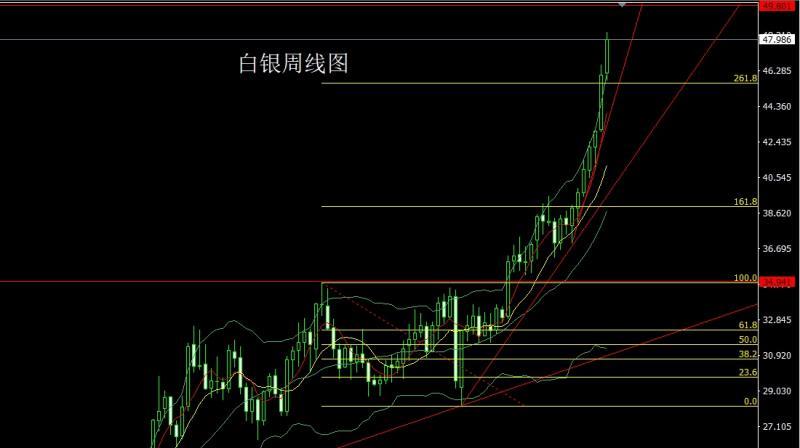
The silver market opened at 46.174 last week and then the market first rose to 47.193, and then the market fell rapidly. The weekly line was at the lowest point of 45.757 and then the market rose strongly. The weekly line reached the highest point of 48.383 and then the market consolidated. The weekly line finally closed at 47.986 and the market closed with a large positive line with an upper and lower shadow line. After this pattern ended, there was still a long demand this week. At the point, the long position of 37.8 and the long position of 38.8 below were reduced and the long position of 38.8 were stopped.Loss follow-up is held at 42. The stop loss following the 44.6 position reduction is held at 44.8, and today the 47.25 position reduction is 47. The target is 47.8 and 48.4 and 48.7-49.
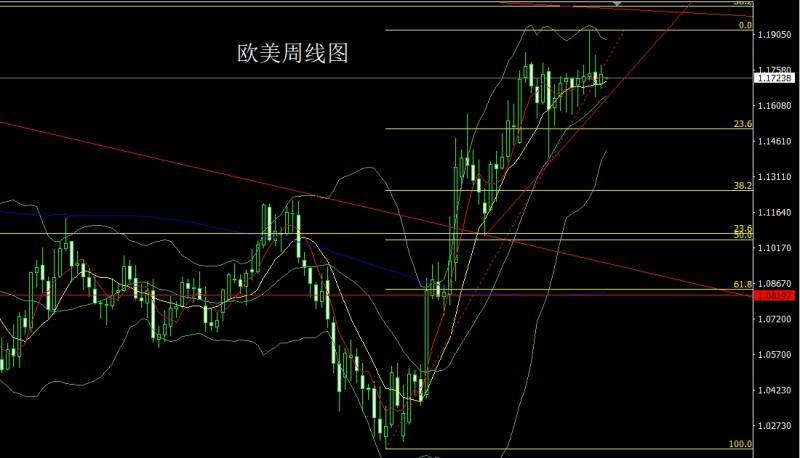
The European and American markets opened at 1.07013 last week and the market first rose to 1.17784, and then the market surged and fell. The weekly line was at the lowest point of 1.16818 and then the market rose at the end of the trading session. The weekly line finally closed at 1.17390 and the market closed in a spindle pattern with an upper shadow line slightly longer than the lower shadow line. After this pattern ended, the short position of 1.17450 last Friday and the stop loss followed at 1.17550, and today the 1.17350 Alginate sodium 1.17550, the target is 1.17100 and 1.16850 and 1.16600.
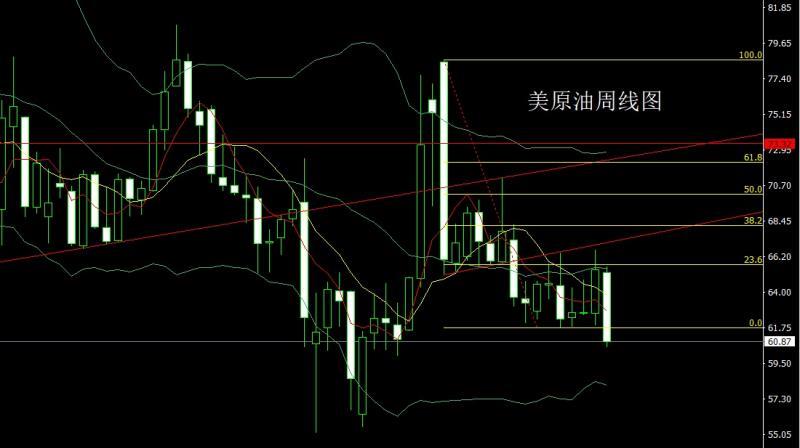
Last week, the US crude oil market opened low at the beginning of the week at 65.22, and the market filled the gap and gave a position of 65.62, and the market fluctuated strongly. The weekly line was given the lowest position of 60.54, and the market was consolidated at the low position. The weekly line finally closed at 60.87, and the weekly line closed with a large negative line with an upper shadow line slightly longer than the lower shadow line. After this pattern ended, the weekly line was negative and the support was broken. At the point, the short stop loss of 63 today was 62.5, and the target was 61.4 and 61 and 60.5-60.
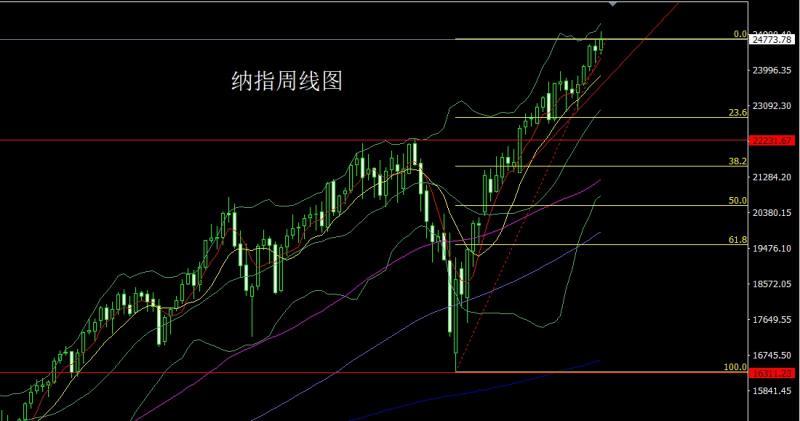
The Nasdaq market opened at 24513.24 last week and the market first rose. The market fluctuated and fell. The weekly line was at the lowest point of 24406.84 and then rose strongly. The weekly line reached the highest point of 24986.55 and then consolidated. After the weekly line finally closed at 24773.4, the weekly line closed with a medium-positive line with an upper shadow line slightly longer than the lower shadow line. After this pattern ended, the 24950 short stop loss of 25010 this week, and the target was 24800 and 24700 and 24650 and 24600.
Fundamentals, the fundamentals of last week were postponed due to the official government employment report being postponed, and some people turned to ADP employment estimate data. This report only measures the employment situation of the private sector. The sometimes unreliable report xm217.compared to official data has performed quite negatively this week, showing that the U.S. private sector lost 32,000 jobs in September. As of now, the market continues to fully price the Fed will cut interest rates at its October meeting, and the probability of interest rate cuts in December is also priced at around 90%. The current government shutdown and the resulting lack of new economic data may not change this long-standing debate. As long as the door shutdown does not last too long, the affected government staff will receive all the wages arrears, which means that the permanent damage to the economy should be minimal. The only uncertainty is whether the threat of mass layoffs will actually happen. The job report scheduled for Friday was postponed due to the government shutdown last Friday, and Fed officials are currently "driving with their eyes closed". This report can be said to be the most important data needed to determine the future direction of monetary policy at a meeting later this month. In the absence of critical government data, Fed policymakers will have to rely on private sector information, as well as some of the things many local Fed have learned about and investigations into business owners. Without the guidance of non-farm data released by the U.S. Department of Labor, the Fed's rate cut this month will be the key to the next step, focusing on the monthly retail sales rate in the euro zone at 17:00 today. Look at the US global supply chain pressure index at 22:00 in the evening. European Central Bank President Lagarde, who was following 1:00 a.m. on Tuesday, made an introductory statement to the European Parliament's Economic and Monetary Affairs xm217.committee (ECON). Check out the US August trade account at 20:30 in the evening. Look at the US New York Fed's 1-year inflation expectations in September at 23:00 later. We focused on 22:30 U.S. to October 3rd week, and U.S. to Cushing, Oklahoma, crude oil inventories and U.S. to October 3rd week, and U.S. to October 3rd week, EIA strategic oil reserve inventories. On Thursday, we will pay attention to the release of minutes of the Federal Reserve's monetary policy meeting at 2:00 a.m. At 19:30 in the evening, the European Central Bank released the minutes of the September monetary policy meeting. Then watch the opening speech (pre-recorded) of the Federal Reserve Chairman Powell at 20:30 and the number of initial unemployment claims in the United States to the week of October 4. Look at the monthly wholesale sales rate in the United States at 22:00 a little later. On Friday, we focused on the initial value of the first year-on-year inflation rate in the United States at 22:00 and the initial value of the University of Michigan Consumer Confidence Index in October.
In terms of operation, gold: 3325 and 3322 long and 3377 and 3385 long and 3563 long and 3563 long and 3650 last week, and the stop loss followed by holding at 3650. Today, the decline first gave 3860 long and 3854. The target was 3885 and 3892 and 3899. The break was 3910 and 3920 and 3928-3933.
Silver: 37.8 long and 38.8 long and 38.8 long and 38.8 long and 42. The stop loss after the long position of 44.6 was held at 44.8, and today was 47.25 was long. The target was 47.8 and 48.4 and 48.7-49.
Europe and the United States: The stop loss after the short position of 1.17450 was followed by 1.17550, and today was 1.17350 was 1.17550, and the target was 1.17100 and 1.16850 and 1.16600.
U.S. crude oil: 62.5 was short stop loss 63, and the target was 61.4 and 61 and 60.5-60.
Nasdaq Index: 24950 short stop loss this week 25010, with a target of 24800 and 24700 and 24650 and 24600.
The above content is all about "[XM Foreign Exchange Decision Analysis]: Data blindly drives at night, gold and silver are big and cautious", which is carefully xm217.compiled and edited by the editor of XM Foreign Exchange. I hope it will be helpful to your trading! Thanks for the support!
After doing something, there will always be experience and lessons. In order to facilitate future work, we must analyze, study, summarize and concentrate the experience and lessons of previous work, and raise it to the theoretical level to understand it.
Disclaimers: XM Group only provides execution services and access permissions for online trading platforms, and allows individuals to view and/or use the website or the content provided on the website, but has no intention of making any changes or extensions, nor will it change or extend its services and access permissions. All access and usage permissions will be subject to the following terms and conditions: (i) Terms and conditions; (ii) Risk warning; And (iii) a complete disclaimer. Please note that all information provided on the website is for general informational purposes only. In addition, the content of all XM online trading platforms does not constitute, and cannot be used for any unauthorized financial market trading invitations and/or invitations. Financial market transactions pose significant risks to your investment capital.
All materials published on online trading platforms are only intended for educational/informational purposes and do not include or should be considered for financial, investment tax, or trading related consulting and advice, or transaction price records, or any financial product or non invitation related trading offers or invitations.
All content provided by XM and third-party suppliers on this website, including opinions, news, research, analysis, prices, other information, and third-party website links, remains unchanged and is provided as general market commentary rather than investment advice. All materials published on online trading platforms are only for educational/informational purposes and do not include or should be considered as applicable to financial, investment tax, or trading related advice and recommendations, or transaction price records, or any financial product or non invitation related financial offers or invitations. Please ensure that you have read and fully understood the information on XM's non independent investment research tips and risk warnings. For more details, please click here